Add zoomed inset panels to your ggplot maps.
Installation
You can install ggmapinset like so:
# CRAN release
install.packages('ggmapinset')

# development version
install.packages('ggmapinset', repos = c('https://cidm-ph.r-universe.dev', 'https://cloud.r-project.org'))
Replacing ‘ggplot2’ sf layers
ggmapinset provides drop-in replacements for each of the sf-related layers from ggplot2:
ggplot2 function |
ggmapinset replacement |
|---|---|
geom_sf() |
geom_sf_inset() |
geom_sf_text() |
geom_sf_text_inset() |
geom_sf_label() |
geom_sf_label_inset() |
stat_sf() |
stat_sf_inset() |
stat_sf_coordinates() |
stat_sf_coordinates_inset() |
coord_sf() |
coord_sf_inset() |
The replacements work the same as their normal versions but copy, zoom, and clip the layers to make the inset work. The stats can be used to add inset support to geoms from third-party packages. For extension developers, tools are provided to make sf-based layers inset-aware (see ggautomap for examples).
Example
This example adds an inset to the first example from ggplot2::geom_sf(). The inset area is defined as a circle centred on the named county, with radius 50 miles. The inset is enlarged by a factor of 2 and shifted to an empty part of the map.
library(ggmapinset)
library(ggplot2)

# load the North Carolina map example shipped with sf
nc <- sf::st_read(system.file("shape/nc.shp", package = "sf"), quiet = TRUE)

inset_cfg <- configure_inset(
  shape_circle(
    centre =  sf::st_centroid(nc[nc$NAME == "Yancey",]),
    radius = 50
  ),
  scale = 2,
  units = "mi",
  translation = c(70, -180)
)
#> Warning: st_centroid assumes attributes are constant over geometries

# pick some counties to label
labelled_counties <- sample(nc$NAME, 10)
data_subset <- function(df) df[df$NAME %in% labelled_counties,]
# with inset added
ggplot(nc) +
  geom_sf_inset(aes(fill = AREA)) +
  geom_inset_frame() +
  geom_sf_label_inset(
    aes(label = NAME),
    data = data_subset
  ) +
  coord_sf_inset(inset_cfg)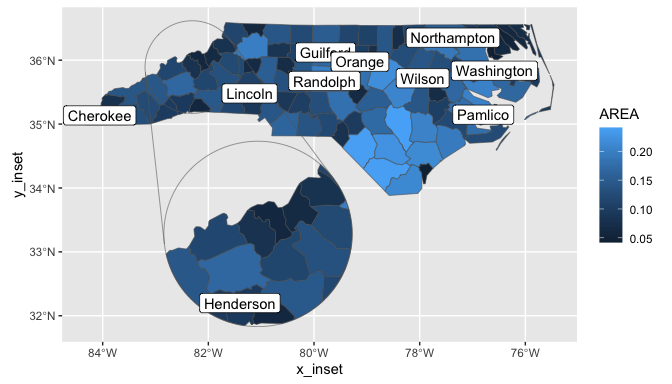
For more information, see the online documentation and vignette("ggmapinset").
Limitations
The package implements insets by duplicating and transforming spatial data within a single coordinate system. That means that you don’t get separate grid lines for the inset panel and, more significantly, the inset can be distorted by the projection of the base map if you move it too far. This tends not to be a problem in practice if you choose a coordinate system that isn’t too distorted over the area of the base map.
Alternatives
Other packages implement different approaches:
-
facet_zoom()from ggforce -
geom_magnify()from ggmagnify -
mf_inset_on()from mapsf
There are also several articles describing more manual ways to achieve different insets: