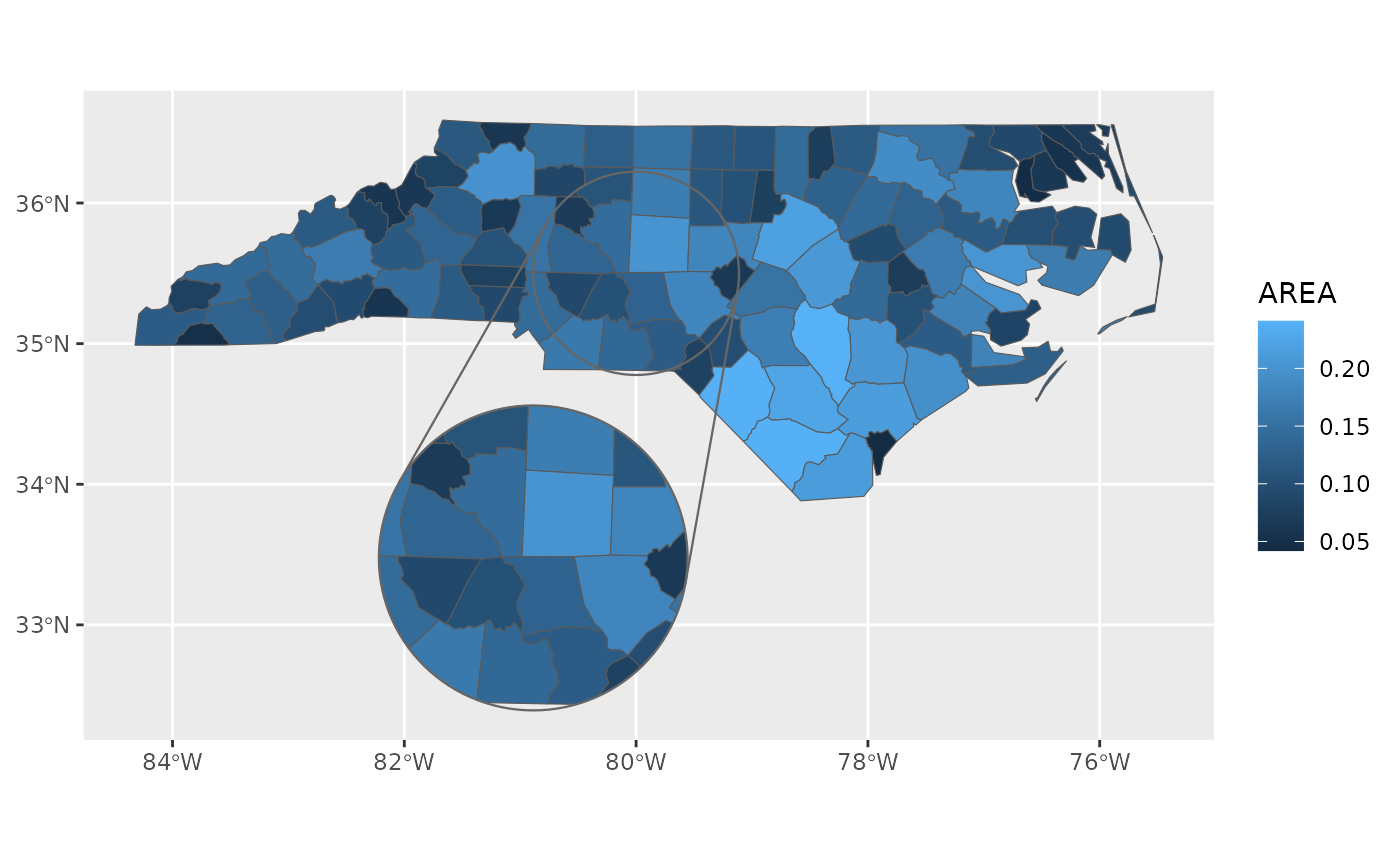
These geoms are wrappers around ggplot2::geom_sf() and its relatives that
assist with creating map insets.
In many cases all that is needed is to use coord_sf_inset() with configure_inset()
to configure the location and transformation of the inset, and then replace the
sf-related geoms with their _inset counterparts.
Use geom_inset_frame() to add a frame around the inset that connects it to the main map.
Usage
geom_sf_inset(
  mapping = ggplot2::aes(),
  data = NULL,
  stat = "sf_inset",
  position = "identity",
  ...,
  inset = NA,
  map_base = "normal",
  map_inset = "auto",
  na.rm = TRUE,
  show.legend = NA,
  inherit.aes = TRUE
)

stat_sf_inset(
  mapping = ggplot2::aes(),
  data = NULL,
  geom = "sf_inset",
  position = "identity",
  ...,
  inset = NA,
  na.rm = TRUE,
  show.legend = NA,
  inherit.aes = TRUE
)
Arguments
- mapping, data, stat, geom, position, na.rm, show.legend, inherit.aes, ...
See
ggplot2::geom_sf().- inset
Inset configuration; see
configure_inset(). IfNA(the default), this is inherited from the coord (seecoord_sf_inset()).- map_base
Controls the layer with the base map. Possible values are
"normal"to create a layer as though the inset were not specified,"clip"to create a layer with the inset viewport cut out, and"none"to prevent the insertion of a layer for the base map.- map_inset
Controls the layer with the inset map. Possible values are
"auto"to choose the behaviour based on whetherinsetis specified,"normal"to create a layer with the viewport cut out and transformed, and"none"to prevent the insertion of a layer for the viewport map.
Value
A ggplot layer similar to ggplot2::geom_sf() but transformed according to the
inset configuration.
Details
Internally this works by creating two layers: one for the base map, and one
for the inset. These can be separately controlled by the map_base and
map_inset parameters. If inset is not specified, this geom will instead
behave like ggplot2::geom_sf().
When an inset is configured, the default creates both base and inset layers using the same aesthetic mapping and params:
You can alternatively specify the two layers separately:
# draw the base map only (both versions are equivalent):
geom_sf(...)
geom_sf_inset(..., map_inset = "none")

# separately, draw the inset map only:
geom_sf_inset(..., map_base = "none")
stat_sf_inset() works the same ggplot2::stat_sf() except that it also
expands the axis limits to account for the inset area.
Examples
library(ggplot2)

nc <- sf::st_read(system.file("shape/nc.shp", package = "sf"), quiet = TRUE)

ggplot(nc) +
  geom_sf_inset(aes(fill = AREA)) +
  geom_inset_frame() +
  coord_sf_inset(configure_inset(
    shape_circle(
      centre = sf::st_sfc(sf::st_point(c(-80, 35.5)), crs = sf::st_crs(nc)),
      radius = 50
    ),
    scale = 1.5, translation = c(-50, -140), units = "mi"
  ))
