This is mostly equivalent to ggplot2::stat_bin() except that the bin edges
are copied from the scale breaks. For this effect to work properly, you
either need to use fixed scale breaks (e.g. using a vector instead of a
function), or use the breaks_cached() helper.
Usage
stat_bin_auto(
  mapping = NULL,
  data = NULL,
  geom = "bar",
  position = "stack",
  ...,
  breaks = "all",
  na.rm = FALSE,
  show.legend = NA,
  inherit.aes = TRUE,
  pad = FALSE,
  binwidth = NULL,
  bins = NULL,
  centre = NULL,
  boundary = NULL
)
Arguments
- mapping, data, geom, position, na.rm, show.legend, inherit.aes, pad, ...
See
ggplot2::stat_bin().- breaks
Which breaks from the scale should be used?
"minor"for minor breaks,"major"for major breaks, or"all"for both.- bins, binwidth, centre, boundary
Ignored.
Examples
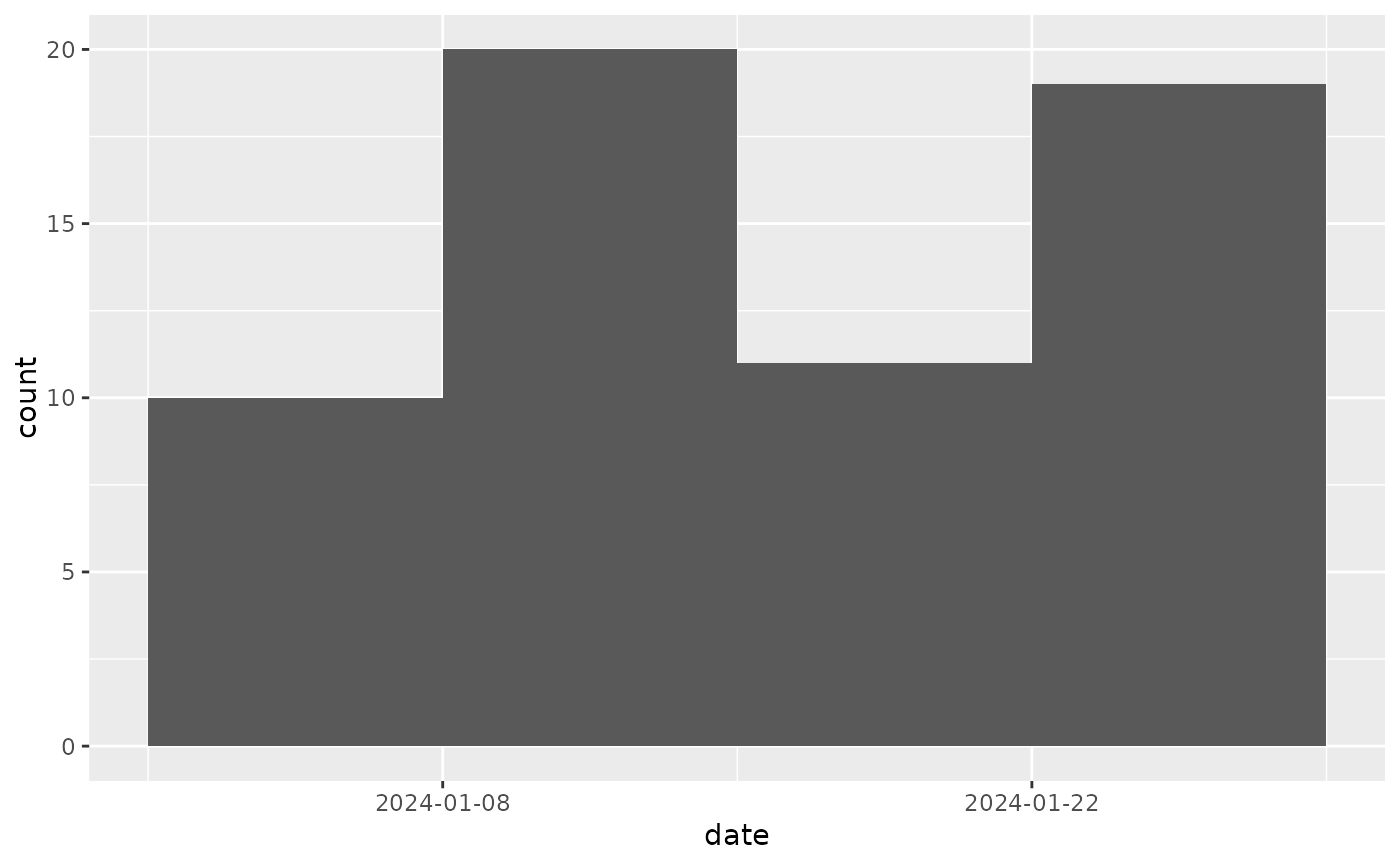
library(ggplot2)

set.seed(1)
events <- rep(as.Date("2024-01-31") - 0:30, rpois(31, 2))
df <- data.frame(date = events)

ggplot(df) +
  stat_bin_auto(aes(date)) +
  scale_x_date(breaks = week_breaks(2L, week_start = "Monday"))