Summarise regions with pie charts
Usage
geom_pie(
  mapping = ggplot2::aes(),
  data = NULL,
  stat = "centroid_pie",
  position = "identity",
  ...,
  feature_type = NA,
  pie_radius = 1,
  proportional = FALSE,
  na.rm = TRUE,
  show.legend = TRUE,
  inherit.aes = TRUE
)
Arguments
- mapping, data, stat, position, na.rm, show.legend, inherit.aes, ...
See
ggplot2::geom_sf().- feature_type
Type of map feature. See
feature_types()for a list of registered types. IfNA, the type is guessed based on the values infeature_names.- pie_radius
Scale the side of all pies
- proportional
If
TRUE, scale the pies by the number of rows in each region. The radius of each pi is proportional to the count.
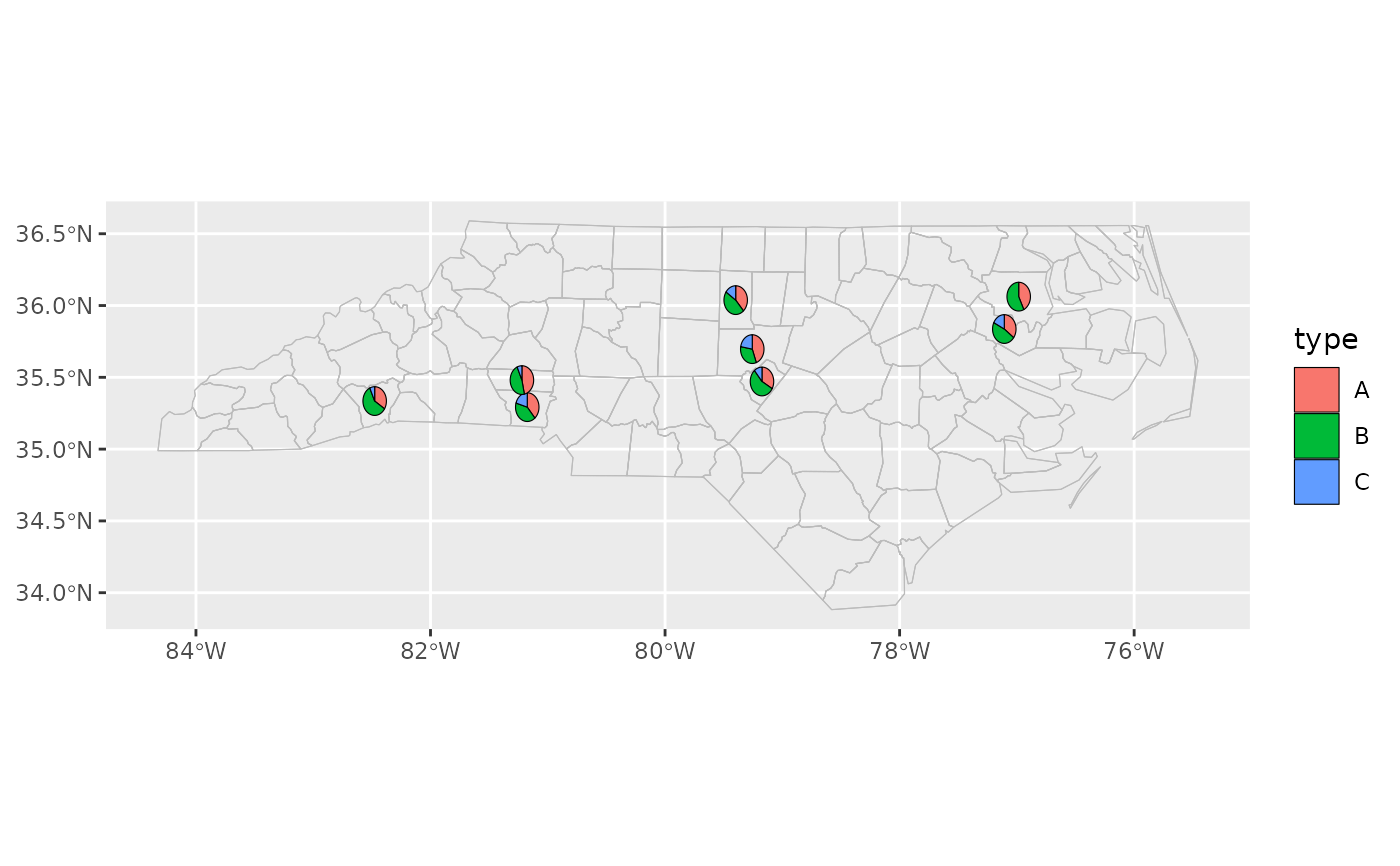
Examples
library(ggplot2)

cartographer::nc_type_example_2 |>
  ggplot(aes(location = county)) +
  geom_boundaries(feature_type = "sf.nc") +
  geom_pie(aes(fill = type), pie_radius = 0.1)